Analyzing "Brand Ticker" data.
The Brand Ticker provides brand specific marketing data. On a day to day basis they list the brand value and top 3 associations gathered from news mentions and social data. They provide no documentation on how they process the data or which sources they use.
Here is short look at their service. I pulled half a year’s data in irregular intervals from their API using a small r-script. See this GIST
Due to some recent attention we start the analysis by looking at the Volkswagen (VW) data.
##    attr_1 attr_1_flag      attr_2 attr_2_flag   attr_3 attr_3_flag
## 25  liked       green complicated         red advanced       green
## 26  faked         red   polluting         red  secured       green
## 27  liked       green complicated         red advanced       green
## 28  faked         red   polluting         red  secured       green
## 29  faked         red   polluting         red  secured       green
## 30  faked         red   polluting         red  secured       green
##      change    value         brand brandId       Date
## 25 2.957404 5109.233 Volkswagen VW     439 2015-11-25
## 26 3.678028 5389.976 Volkswagen VW     439 2015-11-27
## 27 7.359091 6147.744 Volkswagen VW     439 2015-12-02
## 28 7.359091 6147.744 Volkswagen VW     439 2015-12-02
## 29 2.977252 6574.628 Volkswagen VW     439 2015-12-08
## 30 2.977252 6574.628 Volkswagen VW     439 2015-12-08
The first 6 columns are the brand associations, gathered from news data, or a survey (who knows…?). It’s helpful that the flag attributes already label the associations as positiv/negativ (red or green). The value column is the so-called “Brand Value”.
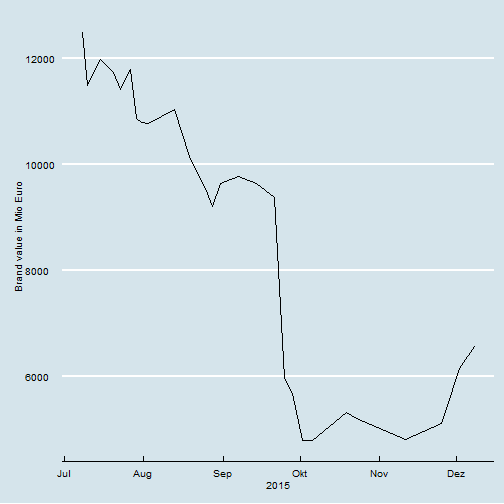
In order to see if the brand value is related to associations, I color-code the brand value with the top (attr_1) association.
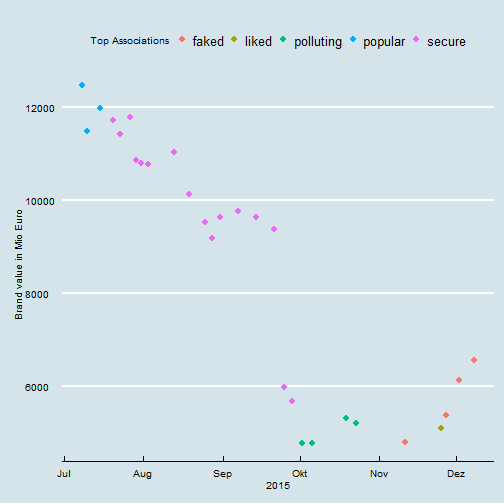
For the diesel-gate event, we see that the top association is a rather lagging than predicting variable. The brand value massively drops, the association remains “secure”. The association change from “secure” to “polluting” happens with a distinct lag. In order to visualize the second and third association, we can use a simple histogram of mentions in the data set.

As before, we can add all associations to the brand value time series.

In order to unterstand the brand value variable it bit better, I scraped VW’s stock market data from Yahoo. See this GIST
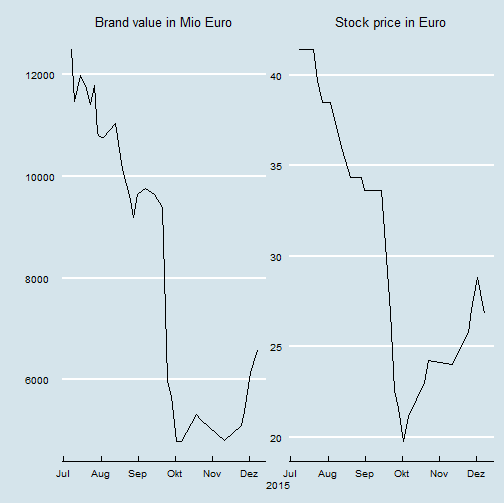
Apparently brand value is just a linear function of stock market data and can be regarded as more or less identical.
| Dependent variable: | ||
| value | ||
| (1) | (2) | |
| Close | 365.498*** | 273.071*** |
| (22.435) | (6.069) | |
| Constant | -3,057.386*** | |
| (724.722) | ||
| Observations | 30 | 30 |
| R2 | 0.905 | 0.986 |
| Adjusted R2 | 0.901 | 0.985 |
| Residual Std. Error | 854.555 (df = 28) | 1,073.895 (df = 29) |
| F Statistic | 265.414*** (df = 1; 28) | 2,024.172*** (df = 1; 29) |
| Note: | *p<0.1; **p<0.05; ***p<0.01 | |
I find it quite misleading to speak of “Brand Value” and taking stock market data as a reference. Plenty of factors (economic condictions, production costs, …) have an impact on stock prices, while the value of a brand is related to subjective perceptions.