How to create a ggplot Theme - Unicorn Edition
Themes are an convenient way to give ggplot charts an individualized, sometimes stylish look. Most of the time, I rely on the ggthemes package and the Economist style. Last week colleagues asked me to change the look of my charts. We joked around and I agreed to create a unicorn ggplot theme. I want to use the challenge to detail a) how to create custom ggplot themes and b) look at unicorn startup data.
I took the Unicorn startup dataset, which contains startups with a valuation above 1 bil$.
For the theme, in the first step, I changed some basic parameters (coloring, no ticks axis.ticks=element_blank(), no legend title legend.title = element_blank() and the same background for legend elements as well as the legend background legend.key = element_rect(fill = "lightskyblue1", color = "lightskyblue1")). For the impatient reader; the complete code is at the end of the post.
ggplot(dd, aes(year, N, color=Industry, fill=Industry)) + geom_bar(stat="identity") + xlab("") + ylab("Number of Unicorns") + theme_unicorn(base_size = 5)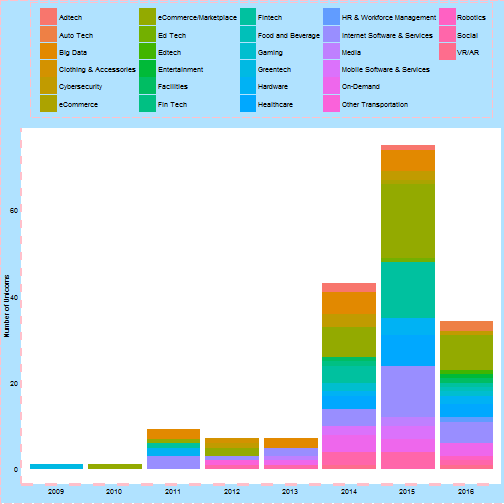
Data-wise, we see that the number of unicorn valuations massively increased in recent years. Most unicorns are active in the area of ecommerce and marketplaces. Theme-wise; while the chart looks colorful, there are some parts missing; font-style and appropriate coloring. In the chart above, ggplot defaulted to the standard color palette for the plotted elements. In order to fix this, I got the “unicorn” color palette from here and created two functions to overwrite the color and fill functions. Additionally, a true unicorn chart needs a different font. Even though it is pretty old, Comic Sans might be appropriate here.
windowsFonts(F = windowsFont('Comic Sans MS'))

p <- ggplot(ddd[1:5,], aes(reorder(Industry, -m), m, color=Industry, fill=Industry)) + geom_point(size=4, shape="O")
p+ theme_unicorn(base_size = 8,font="F") +scale_color_discrete_unicorn()+scale_fill_unicorn() + ylab("Mean Valuation in Bil$")+ xlab("Industries")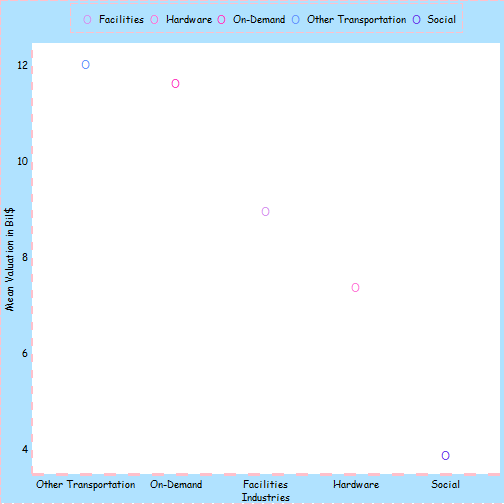
So, what’s missing to complete the unicorn theme? A real unicorn mixed with all the startups. Let’s add an png-image of an unicorn using annotation_custom(g, xmin=30, xmax=35, ymin=10, ymax=12). The annoying part of it is, that one needs to place the image somehow manually on top of the chart using the x,y parameters. I also tried to place it within a bar-chart with factors/categories along the x-axis but I have not been able to figure how to do that.
library(png)
library(grid)
## adding an image
img <- readPNG(source = "image/unicorn.png")
g <- rasterGrob(img, interpolate=TRUE)


p <- ggplot(d4, aes(N, m)) + geom_point(size=2, shape=1, color="purple")
p<- p + theme_unicorn(base_size = 10,font="F")  +xlab("")+ ylab("Mean Valuation in Bil$") + xlab("Number of Unicorns")
p <- p + annotation_custom(g, xmin=30, xmax=35, ymin=10, ymax=12)
p <- p + annotate(geom="text", x=3.5, y=12, label="Transportation", color="lightblue" , family=F)
p <- p + annotate(geom="text", x=12, y=11.5, label="On Demand", color="lightblue")
p <- p + annotate(geom="text", x=34, y=4, label="Ecommerce", color="lightblue")
p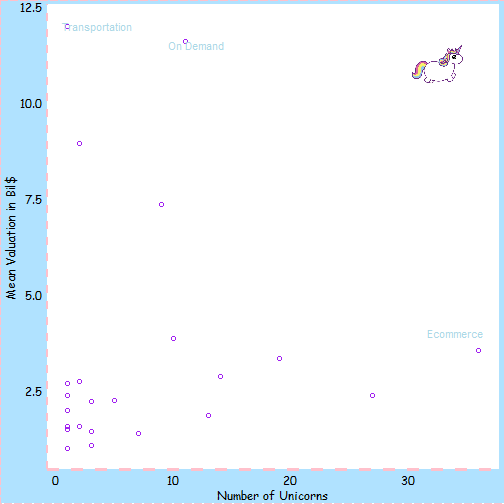
While ggplot certainly has massively improved in terms of style and customizability, there are some parts which do not work 100% (or I was not able to get it working properly). Font-family setting leads to warnings/errors (even though the chart appears). Additionally, the passing of the font-family breaks down. The chart above illustrates that, the axis labels are Comic Sans, the annotated text is not. I tried to set it directly in the annotate-function, but that would not work either.
Another issue is color-setting. Colors have to be defined differently depending on whether one works with a continuous scale or a discrete scale. Hence, they cannot be set within the “theme”, but need to be individually set depending on the chart. While that makes somehow sense, I assume a general custom color-setting function would be highly appreciated. Another encountered issue -when setting custom colors- is the number of colors to be defined in the discrete case. If you pass too many classes (e.g. over 20 industry types as in chart 1), you need to define at least 20+ colors. For the custom scale_color_manual(), it would be great if it would provide a fallback to pick n colors along the colors passed.
I hope you enjoyed the colorful unicorn. Please reach out if you have solutions to the problems mentioned above. I hope I will find the time to create a customizable function in the form of: theme_custom(colorpalette=colors[1:5])