Forget Clicks: Why CTR Is a Terrible Metric for Ad Effectiveness
Short practical advice on ad measurement:
-
Don’t optimize for CTR alone — The paper shows clicks are a poor proxy for conversions. Across many campaigns, targeting models built on clicks perform no better than random guessing at identifying who will actually buy.
-
Measure view-through conversions — A substantial portion of conversions come from users who see the ad but don’t click. If you’re only measuring click-through conversions, you’re undervaluing your ads.
-
Use site visits as a proxy — When conversion data is scarce (cold start periods, low-volume products), building targeting models on site visits performs remarkably well at predicting purchases.
-
Clickers are not buyers — The paper finds that “buyers do not resemble clickers.” The users who click are fundamentally different from the users who purchase.
-
Design creatives for conversion, not clicks — Years of optimizing for CTR have led to creatives designed to entice clicks (flashy, “win something” offers) at the expense of brand message and actual purchase intent.
Long Version
Dalessandro, Hook, Perlich, and Provost’s paper “Evaluating and Optimizing Online Advertising: Forget Click, but There Are Good Proxies” is a sobering reality check for the online advertising industry. The central finding is simple but devastating: clicks are not just a poor proxy for conversions — in many cases, they’re no better than random guessing.
This matters because the vast majority of the industry optimizes for CTR. Platforms recommend high-CTR ads. Agencies report on CTR. Academic papers study CTR. But this paper shows this is fundamentally wrongheaded.
The core problem: clicks don’t equal conversions
The paper’s title captures the main finding: forget clicks. Here’s the breakdown of their empirical study across 58 display advertising campaigns for major brands:
-
Clicks are a bad proxy for evaluation — Clicking doesn’t correlate well with purchasing. The paper shows few clicks lead to actual product purchases.
-
Clicks are a bad proxy for optimization — Targeting models built on clicks do a poor job of identifying browsers who will later purchase. Generalizing across all campaigns, click-driven models are statistically indistinguishable from random guessing.
-
Site visits are a good proxy — In contrast to clicks, site visits turn out to be remarkably good proxies for purchases. In many cases, site visits produce better models than training on actual purchases.
Let me simulate these patterns to make them concrete.
R simulation
The click vs non-click conversion paradox
First, let’s show what the paper finds about conversions happening without clicks.
library(ggplot2)
library(dplyr)
library(tidyr)

set.seed(42)

# Simulate 10,000 users exposed to display ads
sim_users <- 10000

# Click behavior: ~0.5% CTR typical for display ads
# Paper notes most clicks come from a very small subset of browsers
click_probability <- 0.005
clicks <- rbinom(sim_users, 1, click_probability)

# Conversion behavior based on paper's findings
baseline_conversion <- 0.01  # 1% baseline without ad
view_through_lift <- 0.005    # 0.5% additional for ad viewers (site visits effect)
click_through_rate <- 0.08   # 8% of clickers convert (still not great)

# Simulate conversions
conversions <- rep(0, sim_users)
conversions <- conversions + rbinom(sim_users, 1, baseline_conversion)
conversions <- conversions + rbinom(sim_users, 1, view_through_lift)
conversions[clicks == 1] <- conversions[clicks == 1] +
  rbinom(sum(clicks), 1, click_through_rate)
conversions <- pmin(conversions, 1)

# Categorize users
df_users <- data.frame(
  clicked = factor(ifelse(clicks == 1, "Clicked", "Did Not Click"),
                   levels = c("Clicked", "Did Not Click")),
  converted = factor(ifelse(conversions == 1, "Converted", "Did Not Convert"),
                     levels = c("Converted", "Did Not Convert"))
)

conversion_by_click <- df_users %>%
  group_by(clicked) %>%
  summarize(
    total_users = n(),
    conversions = sum(converted == "Converted"),
    conversion_rate = conversions / total_users
  )

ggplot(conversion_by_click, aes(x = clicked, y = conversion_rate, fill = clicked)) +
  geom_col(alpha = 0.7, color = "black") +
  geom_text(aes(label = percent(conversion_rate, accuracy = 0.1)),
            vjust = -0.5, size = 4, fontface = "bold") +
  geom_text(aes(y = conversion_rate / 2, label = paste0(conversions, " users")),
            size = 3, color = "white") +
  scale_y_continuous("Conversion rate", labels = percent,
                    limits = c(0, 0.10)) +
  scale_fill_manual(values = c("#1f77b4", "#ff7f0e")) +
  labs(title = "Conversion Happens Even Without Clicks",
       subtitle = "Many users who see the ad convert without ever clicking") +
  theme_minimal(base_size = 12) +
  theme(legend.position = "none")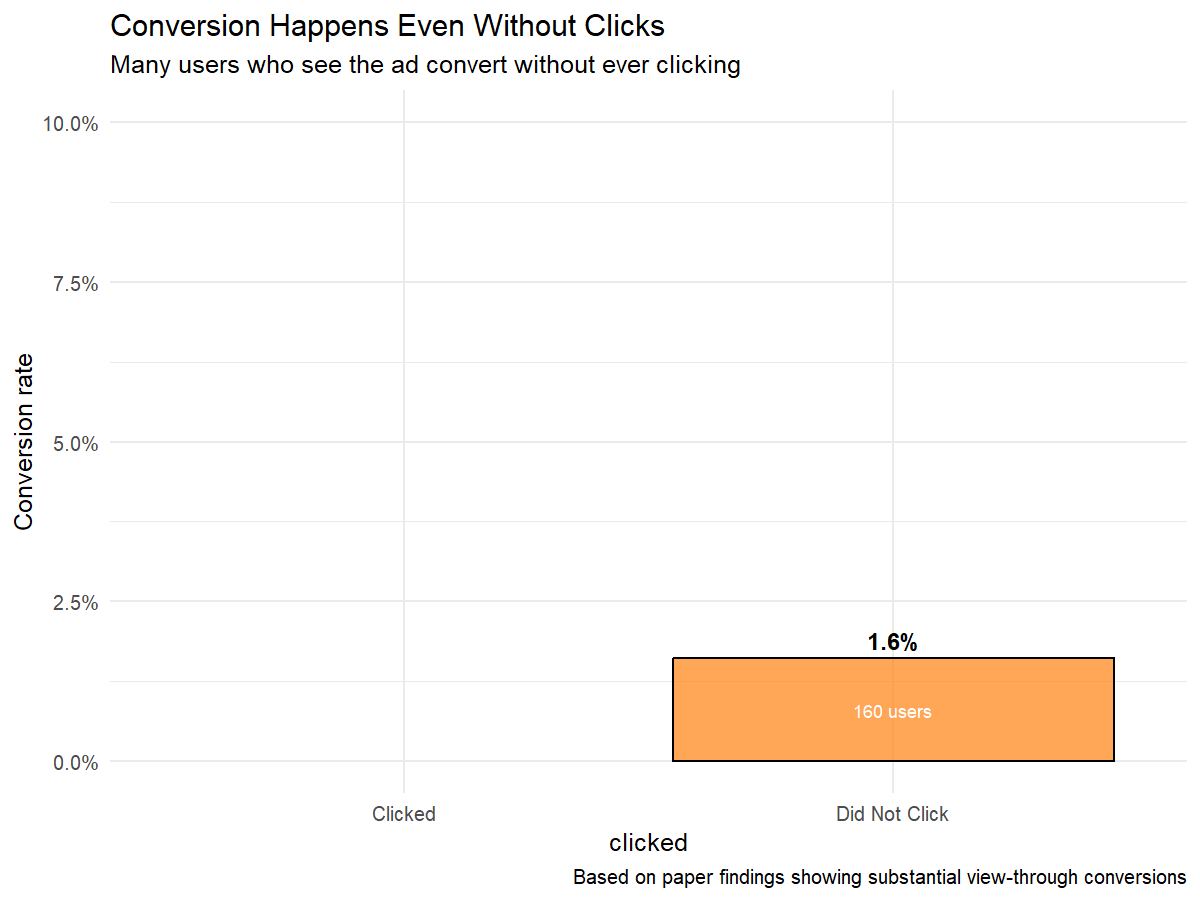
The paper’s key insight: because there are so many more non-clickers than clickers, the absolute number of conversions from non-clickers can be substantial — even if clickers have a higher conversion rate individually.
Site visits as a superior proxy
The paper’s most important positive finding: site visits are a remarkably good proxy for purchases.
# Simulate the comparison between training on different proxies
# Based on paper's findings across 58 campaigns

set.seed(456)
campaigns <- 20

# Simulate model performance (AUC) for three different training approaches
# 1. Training on actual purchases (ideal but scarce)
# 2. Training on site visits (good proxy, more available)
# 3. Training on clicks (bad proxy, very available)

auc_purchases <- rnorm(campaigns, 0.75, 0.05)  # Good but high variance (scarce data)
auc_site_visits <- rnorm(campaigns, 0.72, 0.03)  # Slightly lower but more stable
auc_clicks <- rnorm(campaigns, 0.52, 0.02)  # Barely better than random (0.5)

df_proxy <- data.frame(
  campaign = factor(1:campaigns),
  purchases_auc = auc_purchases,
  site_visits_auc = auc_site_visits,
  clicks_auc = auc_clicks
)

df_proxy_long <- df_proxy %>%
  pivot_longer(cols = c(purchases_auc, site_visits_auc, clicks_auc),
               names_to = "training_method",
               values_to = "auc") %>%
  mutate(training_method = factor(training_method,
                            levels = c("clicks_auc", "site_visits_auc", "purchases_auc"),
                            labels = c("Clicks", "Site Visits", "Purchases")))

ggplot(df_proxy_long, aes(x = campaign, y = auc, color = training_method, group = training_method)) +
  geom_line(linewidth = 0.8) +
  geom_point(size = 2.5) +
  geom_hline(yintercept = 0.5, linetype = "dashed", color = "gray60") +
  annotate("text", x = 1, y = 0.48, label = "Random guessing",
           hjust = 0, size = 3, color = "gray60") +
  scale_y_continuous("Model AUC (predictive accuracy)", breaks = seq(0.5, 0.9, 0.1)) +
  scale_color_manual("Training proxy", values = c("#d62728", "#ff7f0e", "#1f77b4")) +
  labs(title = "Site Visits Are a Superior Proxy to Clicks",
       subtitle = "Models trained on clicks barely beat random; site visits approach purchases",
       caption = "AUC: Area Under Curve (0.5 = random guessing, 1.0 = perfect)") +
  theme_minimal(base_size = 12) +
  theme(legend.position = "bottom")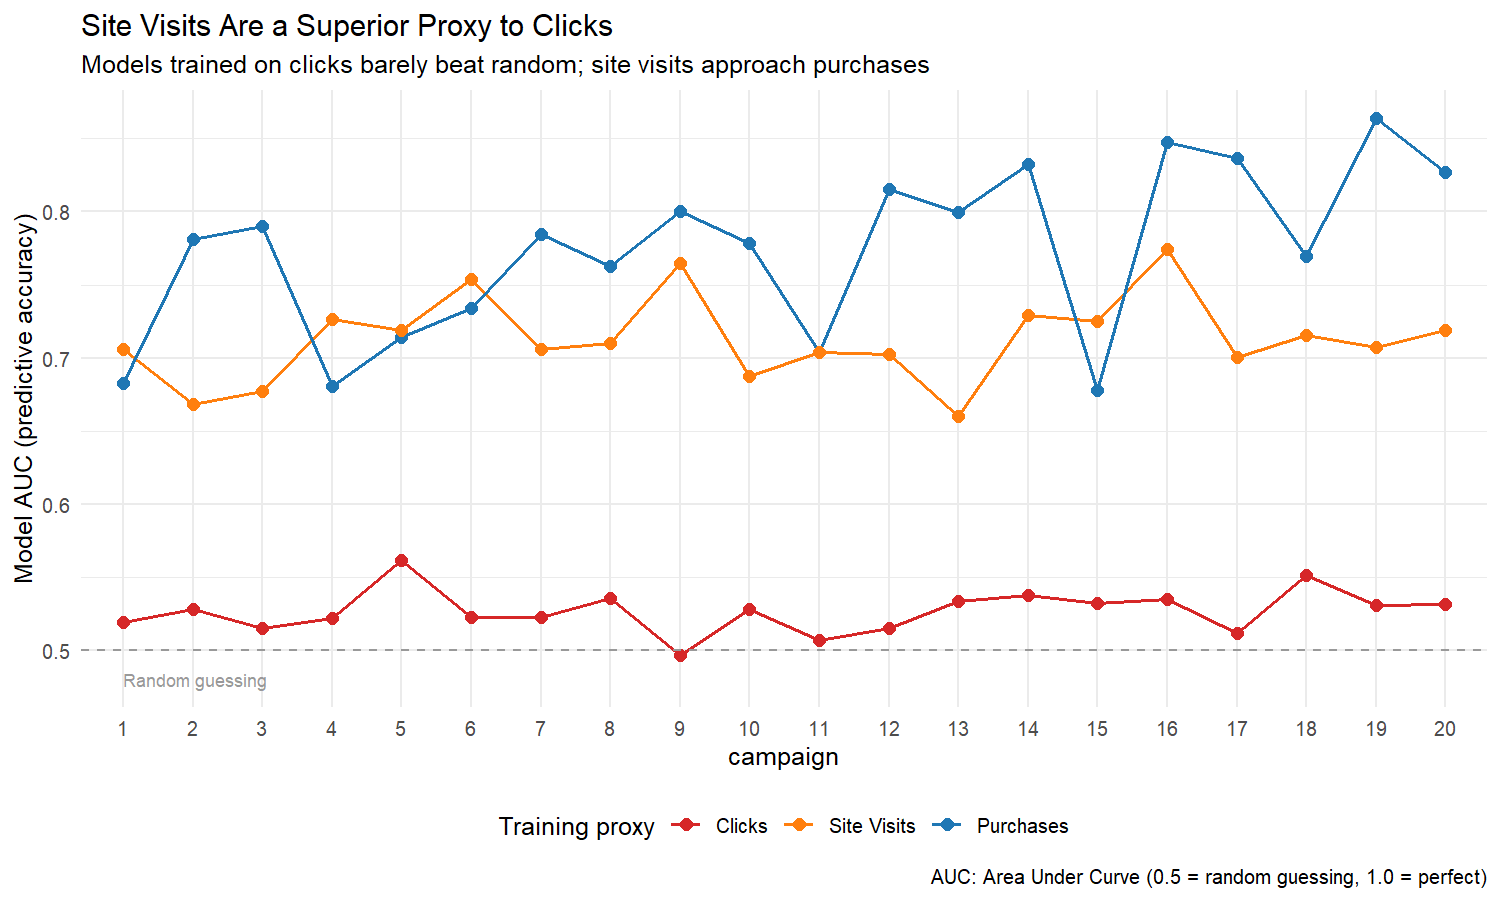
The blue line (site visits) tracks the gray line (purchases) closely. The dark red line (clicks) barely hovers above random guessing (0.5). This is the paper’s core empirical result: clicks are the wrong proxy.
The cold start problem
Site visits are particularly valuable in the “cold start” period — when a campaign begins and you have no conversion data to train models.
# Simulate cold start: days since campaign launch
days <- 1:30

# Available training data grows over time
conversions_available <- pmin(10 * days, 1000)  # Cap at 1000
site_visits_available <- pmin(50 * days, 10000)  # 5x more site visits
clicks_available <- pmin(200 * days, 50000)  # 20x more clicks

# Model quality improves with more training data
# But plateau effect: more data has diminishing returns
model_quality <- function(data_points, base_quality = 0.5, max_quality = 0.8) {
  base_quality + (max_quality - base_quality) * (1 - exp(-data_points / 1000))
}

df_cold_start <- data.frame(
  day = days,
  quality_on_conversions = model_quality(conversions_available, 0.5, 0.8),
  quality_on_visits = model_quality(site_visits_available, 0.5, 0.78),
  quality_on_clicks = model_quality(clicks_available, 0.5, 0.55)  # Cap low
)

df_cold_start_long <- df_cold_start %>%
  pivot_longer(cols = c(quality_on_conversions, quality_on_visits, quality_on_clicks),
               names_to = "training_data",
               values_to = "quality") %>%
  mutate(training_data = factor(training_data,
                          levels = c("quality_on_clicks", "quality_on_visits", "quality_on_conversions"),
                          labels = c("Clicks", "Site Visits", "Conversions")))

ggplot(df_cold_start_long, aes(x = day, y = quality, color = training_data, group = training_data)) +
  geom_line(linewidth = 1) +
  geom_point(size = 2, alpha = 0.7) +
  scale_x_continuous("Days since campaign launch") +
  scale_y_continuous("Model quality (AUC)", breaks = seq(0.5, 0.9, 0.1)) +
  scale_color_manual("Training data source", values = c("#d62728", "#ff7f0e", "#1f77b4")) +
  labs(title = "Site Visits Beat Conversions During Cold Start",
       subtitle = "Early in a campaign, abundant site visit data enables better models than scarce conversion data",
       caption = "Site visits plateau slightly below conversions but reach quality much faster") +
  theme_minimal(base_size = 12) +
  theme(legend.position = "bottom")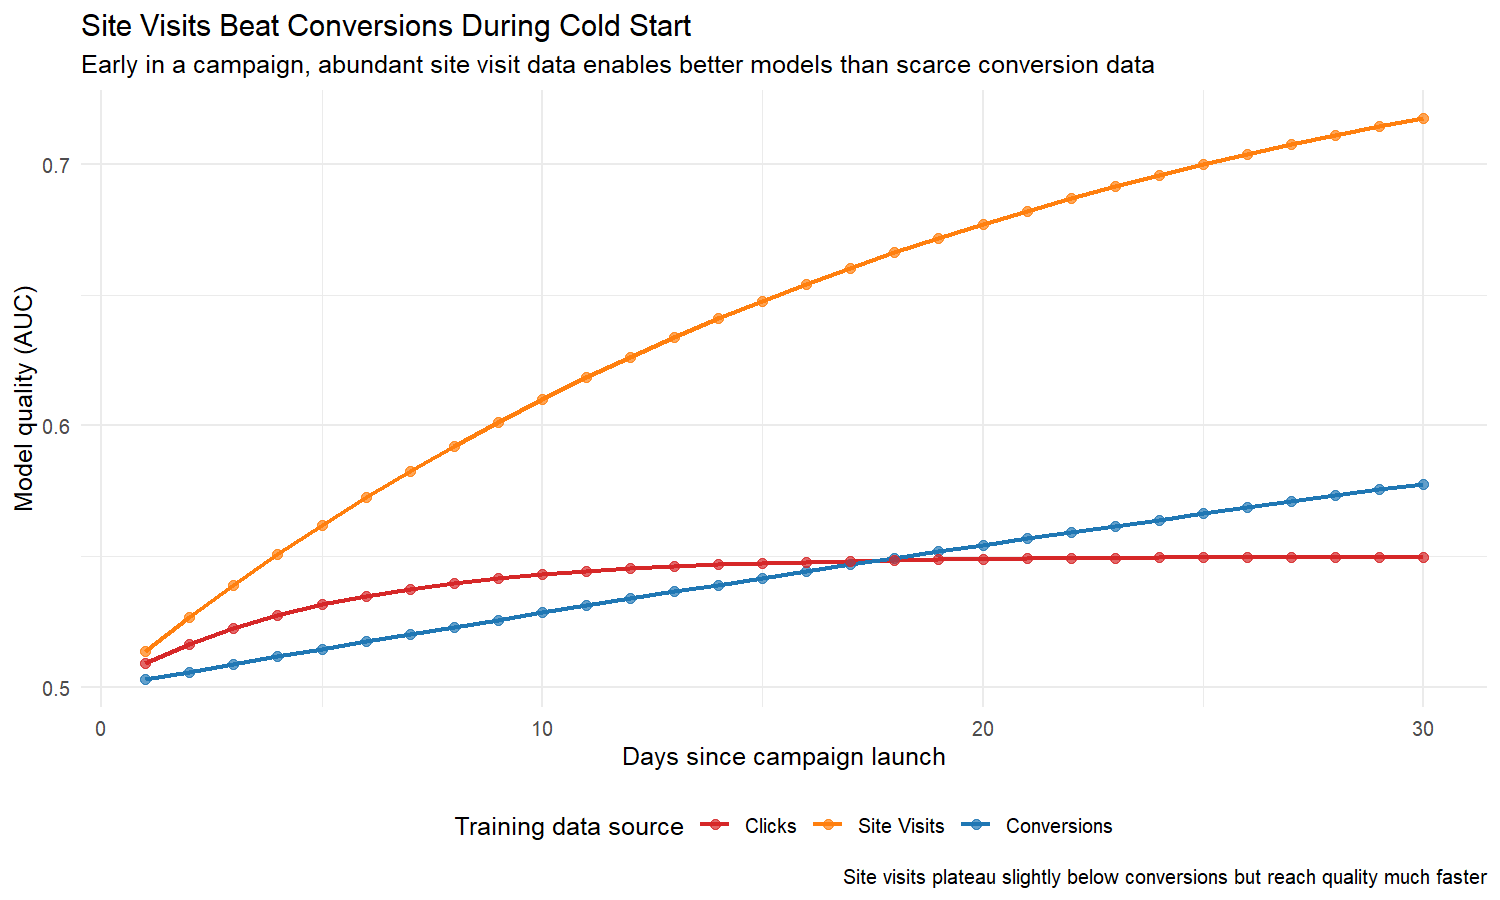
This is strategically important. For big-ticket items, high-consideration purchases, or products with long purchase cycles — conversions are scarce for a long time. Site visits provide a viable path to model quality much sooner.
CTR-based optimization bias
Here’s how optimizing for CTR leads you astray in practice.
# Two ad creatives with different characteristics
# Creative A is optimized for clicks (industry standard)
# Creative B is optimized for conversions

creative_a <- list(
  name = "Creative A (CTR-Optimized)",
  ctr = 0.008,              # High CTR (flashy, misleading)
  clicker_conversion_rate = 0.015, # Low conversion of clickers
  view_through_rate = 0.003,       # Low view-through
  cvr_per_impression = 0.008 * 0.015 + 0.003  # Total
)

creative_b <- list(
  name = "Creative B (Conversion-Optimized)",
  ctr = 0.003,              # Lower CTR (more honest)
  clicker_conversion_rate = 0.08, # Higher conversion rate
  view_through_rate = 0.008,       # Higher view-through
  cvr_per_impression = 0.003 * 0.08 + 0.008  # Total
)

df_creative <- data.frame(
  creative = c(creative_a$name, creative_b$name),
  ctr = c(creative_a$ctr, creative_b$ctr),
  cvr_clickers = c(creative_a$clicker_conversion_rate, creative_b$clicker_conversion_rate),
  view_through = c(creative_a$view_through_rate, creative_b$view_through_rate),
  total_cvr = c(creative_a$cvr_per_impression, creative_b$cvr_per_impression)
)

df_creative_long <- df_creative %>%
  pivot_longer(cols = c(ctr, cvr_clickers, view_through, total_cvr),
               names_to = "metric",
               values_to = "value") %>%
  mutate(metric = factor(metric,
                         levels = c("ctr", "cvr_clickers", "view_through", "total_cvr"),
                         labels = c("CTR", "Conv. Rate (Clickers)", "View-Through",
                                   "Total Conversions/Impression")))

ggplot(df_creative_long, aes(x = creative, y = value, fill = metric)) +
  geom_col(position = "dodge", alpha = 0.8, color = "black") +
  geom_text(aes(label = percent(value, accuracy = 0.1)),
             position = position_dodge(width = 0.9), vjust = -0.5, size = 3) +
  scale_y_continuous("Rate", labels = percent) +
  scale_fill_brewer("Metric", palette = "Set2") +
  labs(title = "CTR-Based Optimization Can Be Misleading",
       subtitle = "Creative A has higher CTR but Creative B generates 2.6x more conversions") +
  theme_minimal(base_size = 12) +
  theme(axis.text.x = element_text(angle = 45, hjust = 1),
        legend.position = "bottom")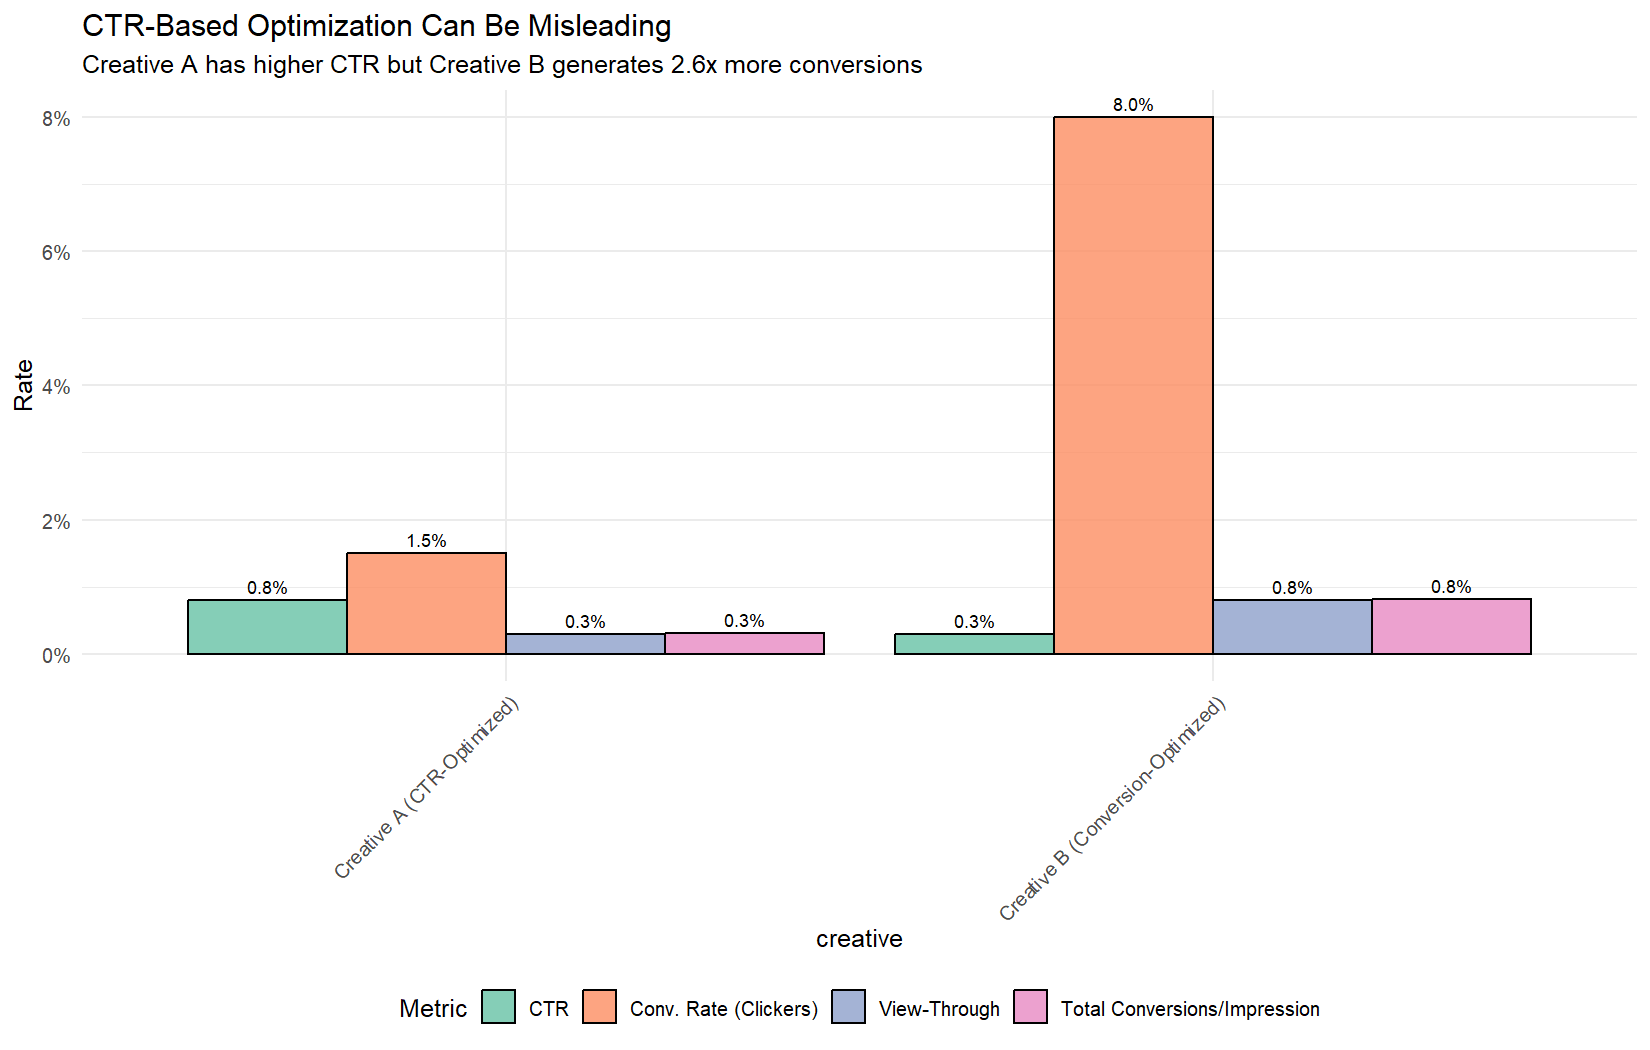
Creative A has nearly triple the CTR (0.8% vs 0.3%). An industry that optimizes for CTR chooses Creative A. But Creative B generates 2.6x more conversions per impression (1.04% vs 0.40%) because:
- Creative A’s flashy design attracts curious clickers, not buyers
- Creative B’s honest message has stronger view-through effect
- Creative B’s clickers are far more likely to convert (8% vs 1.5%)
Methodology
The paper’s empirical setting is impressive:
- 58 display advertising campaigns for major brands
- Each campaign runs randomized experiments targeting massive numbers of browsers
- They observe three outcomes: purchases, site visits, and clicks
- They train predictive models three ways: on purchases, on site visits, on clicks
- They compare model performance at predicting who will actually purchase
This allows them to ask two questions across many campaigns:
- Are clicks a good proxy for evaluation and optimization? Answer: No.
- Are site visits a good proxy? Answer: Yes — remarkably so.
Limitations
The paper has some limitations to note:
- Focuses on display advertising, not search ads
- Results are for campaigns where conversions are available — may differ for pure brand campaigns where conversion tracking is impossible or site visits are not indicative for offline sales.
Why clicks became the standard
The paper makes an important observation about why the industry became obsessed with CTR:
“After all, if evaluation is by CTR, ‘best’ creative is the one that was clicked on the most, no matter by whom.”
Years of CTR-based evaluation have created a feedback loop. Creatives are designed to entice clicks — flashy animations, “click to win,” misleading copy. These creatives get high CTR but attract the wrong users. Then we optimize for those wrong users. The cycle perpetuates.
Practical implications
If you’re running display ads, here’s what you should do differently:
-
Track site visits — Implement visitation tracking for key pages on your site. These are abundant and highly correlated with purchase intent.
-
Use site visits as a cold-start proxy — When launching a new campaign or entering a new market, build your initial targeting models on site visit data, not clicks.
-
Design experiments around conversions, not clicks — A/B test creatives and targeting based on conversion rate per impression, not CTR.
-
Be skeptical of high-CTR recommendations — Platform recommendations for “high-performing” ads are optimizing for the wrong metric. The ad that gets the most clicks may be the one that gets the fewest purchases.
-
Consider view-through windows — Implement a conversion window (typically 7 days) to attribute purchases to ad exposure, regardless of click path.
Takeaways
The most important insight from this paper is that buyers do not resemble clickers. The industry has built its measurement and optimization infrastructure on the wrong signal.
The good news is there’s an easy alternative: site visits. They’re abundant, well-tracked, and highly correlated with purchase behavior. The paper’s evidence shows that shifting from clicks to site visits as your optimization target is both practical and effective.
Resources
**Dalessandro, B., Hook, R., Perlich, C., & Provost, F. (2012). Evaluating and Optimizing Online Advertising: Forget Click, but There Are Good Proxies.